

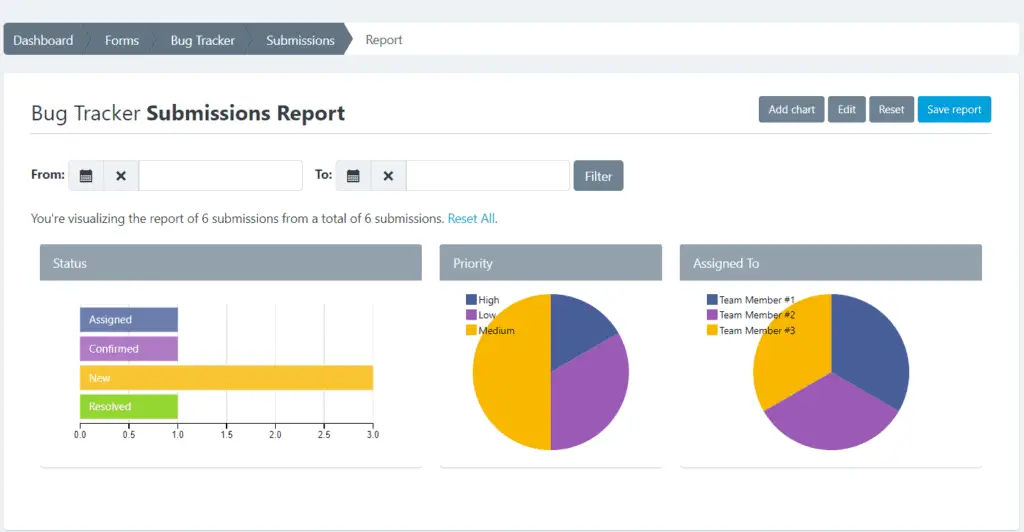
Report Builder in Forms Builder allows you to see the data collected by your form in a visual and interactive way, with the ability of exporting and presenting them as a PDF document.
How To Create Your First Report?
1- To create your first report go to Form Manager. Then, click on the Actions button and select the Submission Report option.
2- A report is made of multiple charts, so next you want to create as many charts as you want for as many fields you have in your Form. For example, you may have an “email field” in your form and you don’t want to capture that in your report, so you can ignore creating a chart for that field.
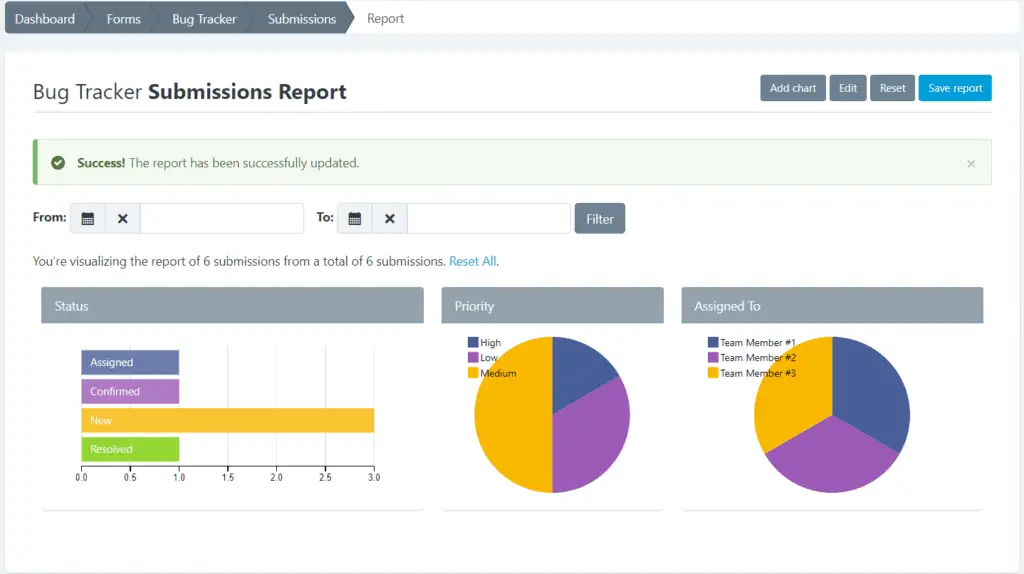
3- When finished editing, click on the Save report button, and a confirmation message will appear assuring you that what you have done is saved
Note: You can only create a report per form.
How To Add A Chart?
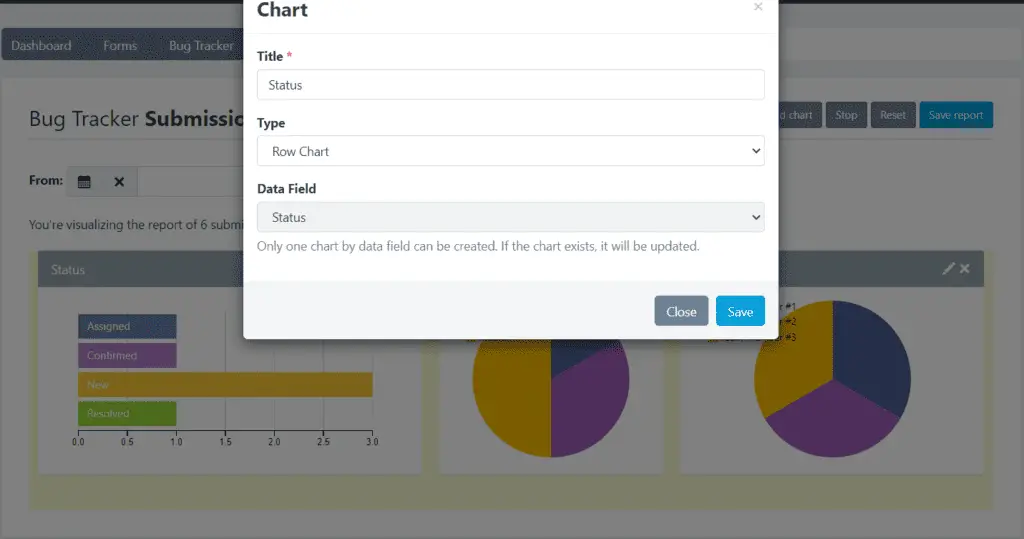
To create a chart:
- Click the Add chart button
- Fill the Title field
- Select the Type of chart
- Select the Field from which to get data
- Click Save
Your chart has been added. Now you just need to Save the report.
How To Edit a Chart?
To edit a chart:
- Click the Edit button. Note that the report has now a yellow background and the Edit button now says Stop. In addition, all charts must show a pencil icon (for editing) and X (to delete).
- Click the pencil icon of the chart to edit.
- In the form that appears, change the data you need.
- Click Save
- When the chart is reloaded, press the Stop button.
Your chart has been edited. Now you just need to Save the report.
How To Delete a Chart?
- Click the Edit button. Note that the report has now a yellow background and the Edit button now says Stop. In addition, all charts must show a pencil icon (for editing) and X (to delete).
- Click on the X icon and the chart will disappear.
- When the chart disappears, press the Stop button
Your chart has been deleted. Now you just need to Save the report.
How To Resize a Chart?
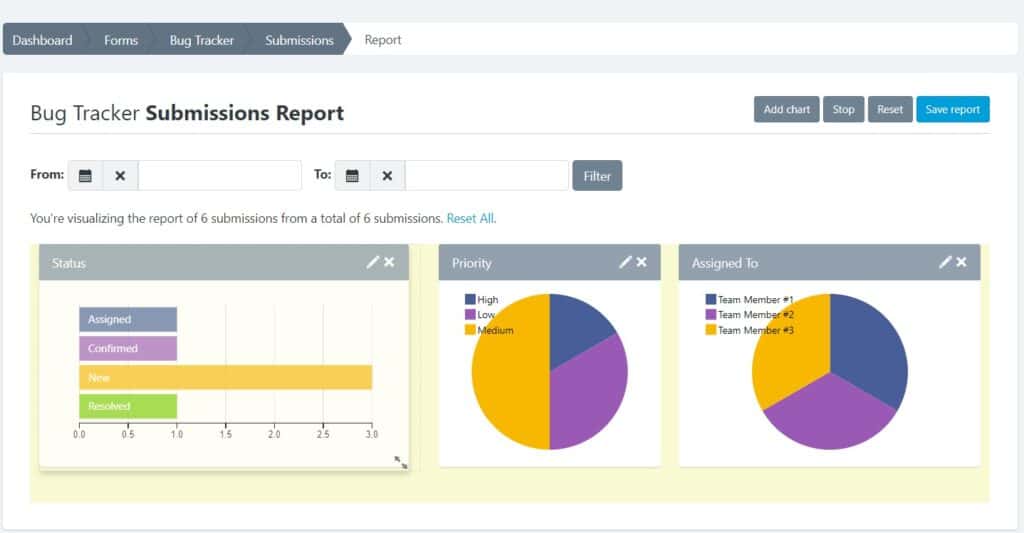
1- Click the Edit button. Note that the report has now a yellow background and the Edit button now says Stop. And when you hover the mouse over a chart an icon will appear in lower right part to resize the it.
2- Click on the icon to resize the chart and drag to make it bigger or smaller.
3- When the chart has the size you need, press the Stop button.
Your chart has been resized. Now you just need to Save the report.
How To Save The Report?
To save the report:
- Be sure you are not in Edit view. Click the Stop button if this still appears.
- Press the Save report button.
- A message will appear confirming that the report has been saved.
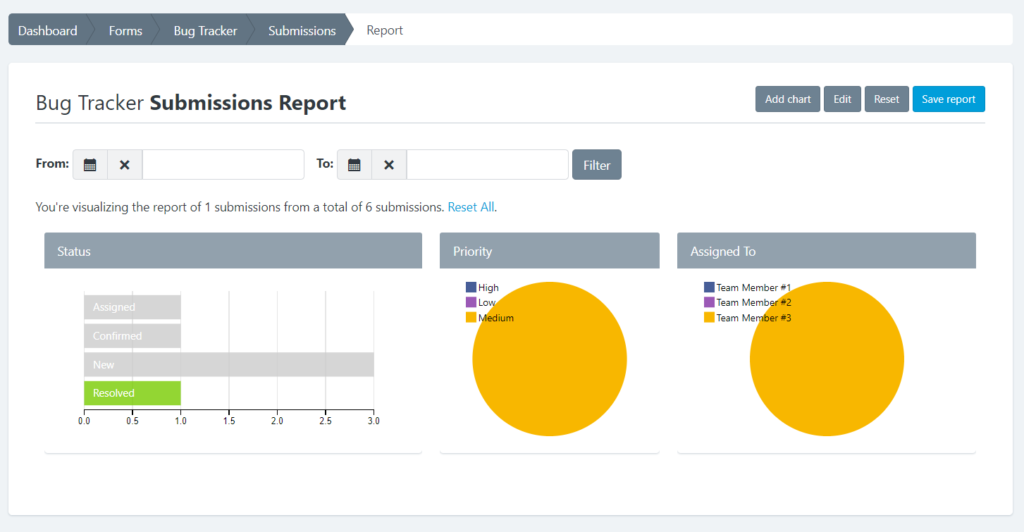
Interacting With The Report
Charts can interact with one another. When you click one of them you will see how the others change to show the chart element information you clicked.
How To Reset a Report?
If you want to create a new report, you can press the Reset button. You will notice that all charts have disappeared. Now you just need to Save the report.
How To Print / Save a Report as PDF Document?
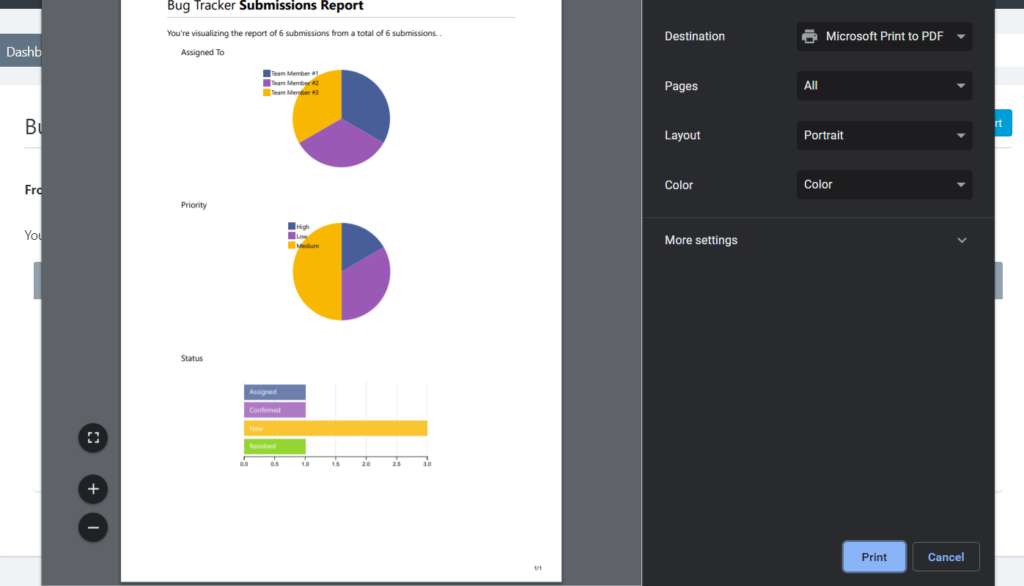
To print a report:
- Press Ctrl + P, or use the browser print feature.
- Select “Microsoft Print to PDF” (Windows) or “Save as PDF” (Mac).
- Now just click “Print“.
Other Forms Builder Manuals
- Forms Builder: Create Forms Easily (Landing Page)
- Forms Builder: Account Manager Manual
- Forms Builder: Form Creation Manual
- Forms Builder: Creating Rules Manual
- Forms Builder: Managing Forms Manual
- Forms Builder: Themes Designer Manual
- Forms Builder: Add-Ons Manager Manual
- Forms Builder: Templates Manual
- Forms Builder: Submission Manager Manual
- Forms Builder: In-App Analytics Manual